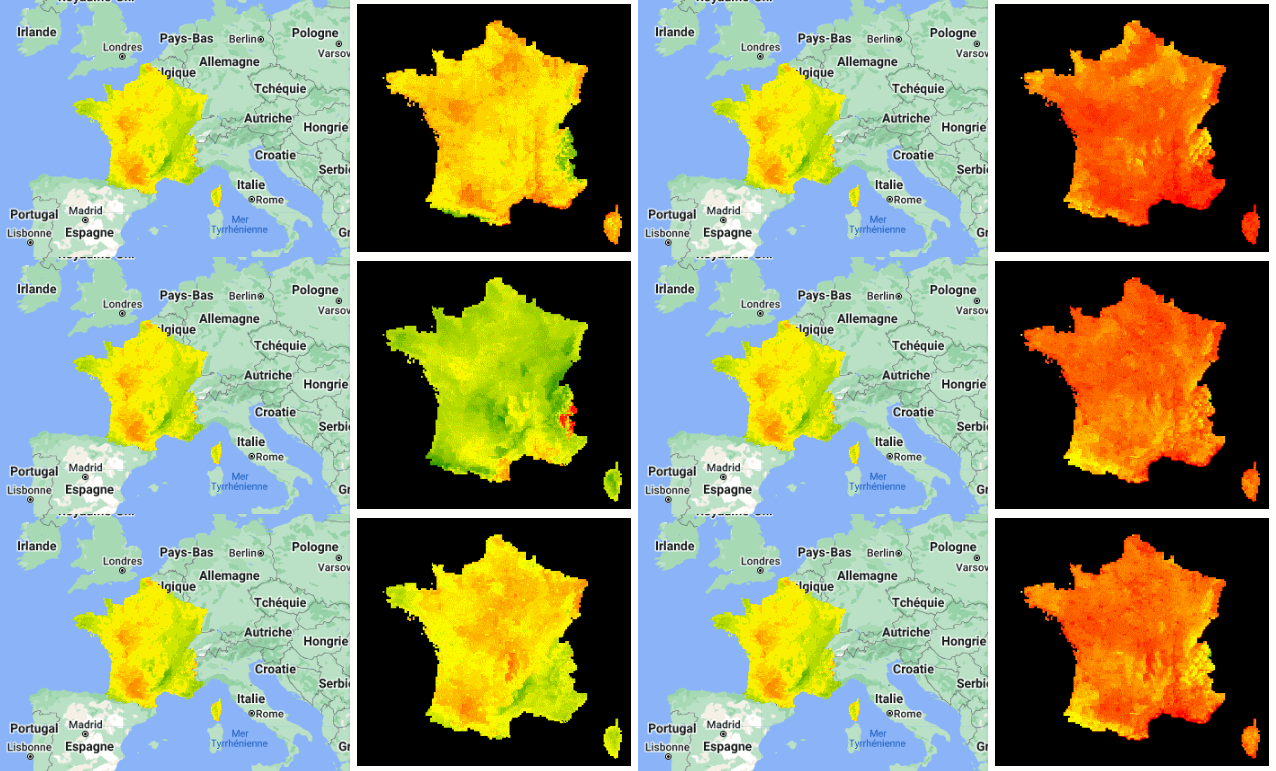
SWI (Soil Wetness Index)
The SWI (Soil Wetness Index) is a soil moisture index. It represents, over a depth of about two meters, the state of the soil water reserve in relation to the useful reserve (water available for plant nutrition).
The uniform SWI is the SWI calculated by the SIM model and used by Météo-France in the reports prepared for the interministerial disaster commission as part of the institution's contribution to the Natural Disaster mechanism. The use of these data and more broadly the role of Météo-France in the CatNat drought system are described in more detail here: http://www.meteofrance.fr/documents/10192/79826318/Météo-France+in+the+device+CATNAT+drought.
The values are provided at monthly time step since January 1, 1969 with a spatial resolution of 8 km. Each monthly value integrates the current month and the two previous months: average of the three of daily SWI values.
Code Editor Snippet
// The region of interest - a planar rectangle around France.
var rect = ee.Geometry.Rectangle({
  coords: [[-5.5, 41.2], [10, 51.5]],
  geodesic: false
});


var collection = ee.ImageCollection("projects/ee-france/assets/METEOFR/SWI/SWI")
  .filterDate('2015-01-01', '2021-01-01').select('SWI')

// Add the first image to the map, just as a preview.
var im = ee.Image(collection.first());
Map.addLayer(im, {min: 0, max: 2, palette: 'red, yellow, green'}, "first image");
Map.centerObject(rect, 5);

// Visualization parameters.
var args = {
  crs: 'EPSG:2154',
  dimensions: '300',
  region: rect,
  min: 0,
  max: 2,
  palette: 'red, yellow, green',
  framesPerSecond: 5,
};

// Create a video thumbnail and add it to the map.
var thumb = ui.Thumbnail({
  image: collection,
  params: args,
  style: {
    position: 'bottom-right',
    width: '320px'
  }});

Map.add(thumb);

Data provider
Citation
Météo-France (2022). SWI - The uniform SWI indicator [Data set]. Accessed 2022-09-01 from Météo-France website.
Licence
Etalab Open License 2.0